USDA is set to release county yields on February 23, and these estimates will provide a lot of clarity on the size of agricultural risk coverage (ARC) payments this fall. While we wait for this information, I think a state-of-play snapshot on corn ARC and an examination of county payment probabilities is helpful.
Much has been made about the ever-declining level of price protection in the corn ARC program. It’s impossible to deny ARC now provides less price protection than it did two years ago, and this decline can be seen in the converging actual farm and ARC benchmark prices in figure 1.
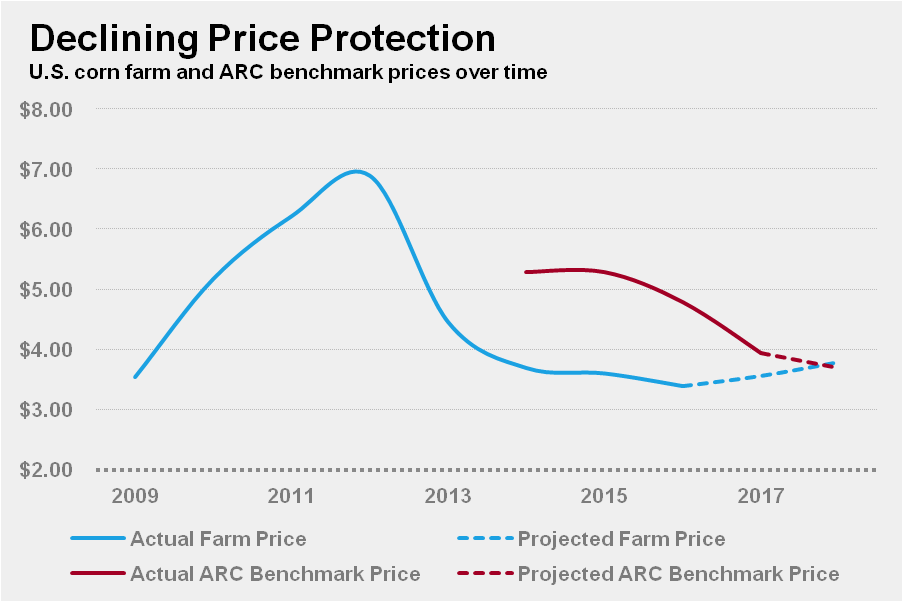
figure 1
The outlook provided by the modified federal baseline in figure 2 tells a similar story. Notice ARC payments decline from a high of $4.2 billion in 2017 to a low of 118 million in 2022.
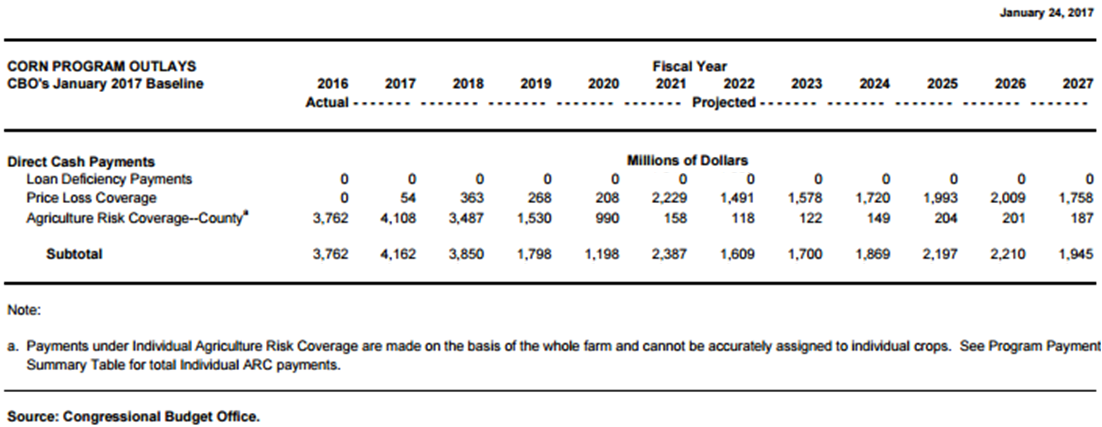
figure 2
The ‘20s are still a few years away, and the 2018 (if we’re lucky) Farm Bill will likely address questions of coverage adequacy well before the U.S. corn industry has a safety net that low. Therefore, I believe a more productive discussion focuses on county-by-county payment probabilities. We should have a clearer picture of these payments when USDA releases preliminary yield estimates in a couple weeks.
Figures 3-5 show each county’s chances of triggering the maximum corn ARC payment for irrigated, non-irrigated and combined practices given a national marketing year average (NMYA) price of $3.40 or the current USDA projection for 2016/17. The average probabilities for irrigated, non-irrigated and combined practices are 75 percent, 60 percent and 70 percent, respectively.
While there are many areas with lower probabilities, some areas are almost guaranteed an ARC payment this October. Notice producers in the heart of the Corn Belt and the Mississippi Delta are still well in the money. In fact, with a NMYA price of $3.40, yields could come in an average of 9.2 percent above normal and the maps wouldn’t change much.
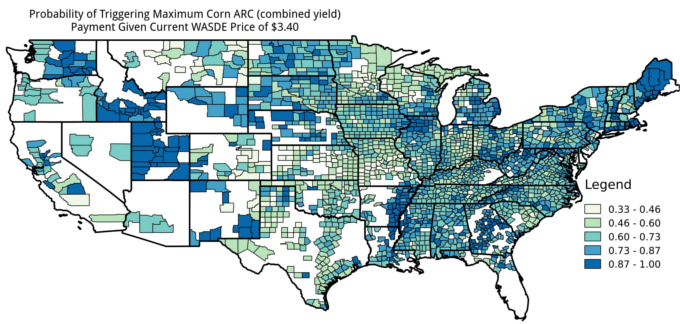
figure 3
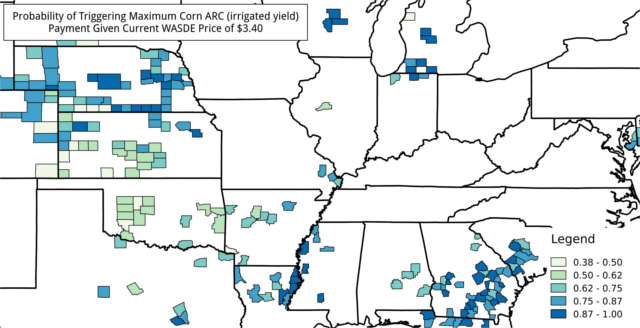
figure 4
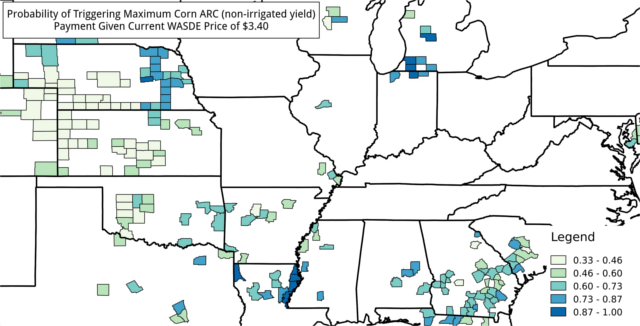
figure 5
How do the probabilities change if the NMYA price changes? The low end of USDA’s projected range is $3.20. Adjusting the model to reflect this lower price results in maximum payment chances of 88 percent, 68 percent and 82 percent. A price of $3.20 also means yields could come in an average of 16.0 percent above normal without materially affecting producers’ chances of collecting maximum payments.
What about a Black Swan event that pushes prices higher? I don’t know a single producer that doesn’t want to see $6.00 corn, and ARC would be irrelevant in this case anyway. The bigger threat would be a minor supply disruption outside the U.S. that results in a modest increase in the NMYA price—but not an increase large enough to make a significant impact on producers’ pocketbooks.
For example when using a NMYA price of $3.90, which would be $0.30/bu above the top end of the WASDE price range, maximum payment probabilities decline to 35 percent, 37 percent and 36 percent. This is because yields would need to come in an average of 4.8 percent below normal to compensate for the lower price. I think it’s safe to say last year’s corn crop was far from below normal.
Typical disclaimers related to forecasting errors and USDA’s black box behavior aside, ARC should provide quite a bit of support for corn producers this October and possibly even next October. However, the $3.90 NMYA price example and the payment expectations in the federal baseline should warn producers to be wary of production costs and price.
No one can control ARC payments, but everyone can control their costs and the price at which they sell their crop. Producers should use this control to their advantage this crop year.